The full data set can be found here.
The data set that I have selected contains 26,600 entries of box scores of every NFL game starting from 2019 to the most recent NFL season. This dataset also contains statistics for offensive linemen such as offensive guards, tackles, and centers. It also has defensive players such as free safeties and cornerbacks. Therefore, the dataset contains countless advanced statistics that are more correlated with other skill positions. Since I was limiting my study to running backs and wide receivers only, most of the dimension reduction was done with selecting the subset of the data that had offensive skill positions, with the columns that had their workload and efficiency stats.
The purpose of this report is to find reason for changes in running back (RB) performance on a season-to-season basis. After dimension reduction, my first step was to find how much their workload stats contributes to their efficiency. To do this, I made a correlation graph that drew rushing attempts and targets’ relationship with efficiency statistics such as rushing yards, touchdowns, receptions, yards per carry, etc.
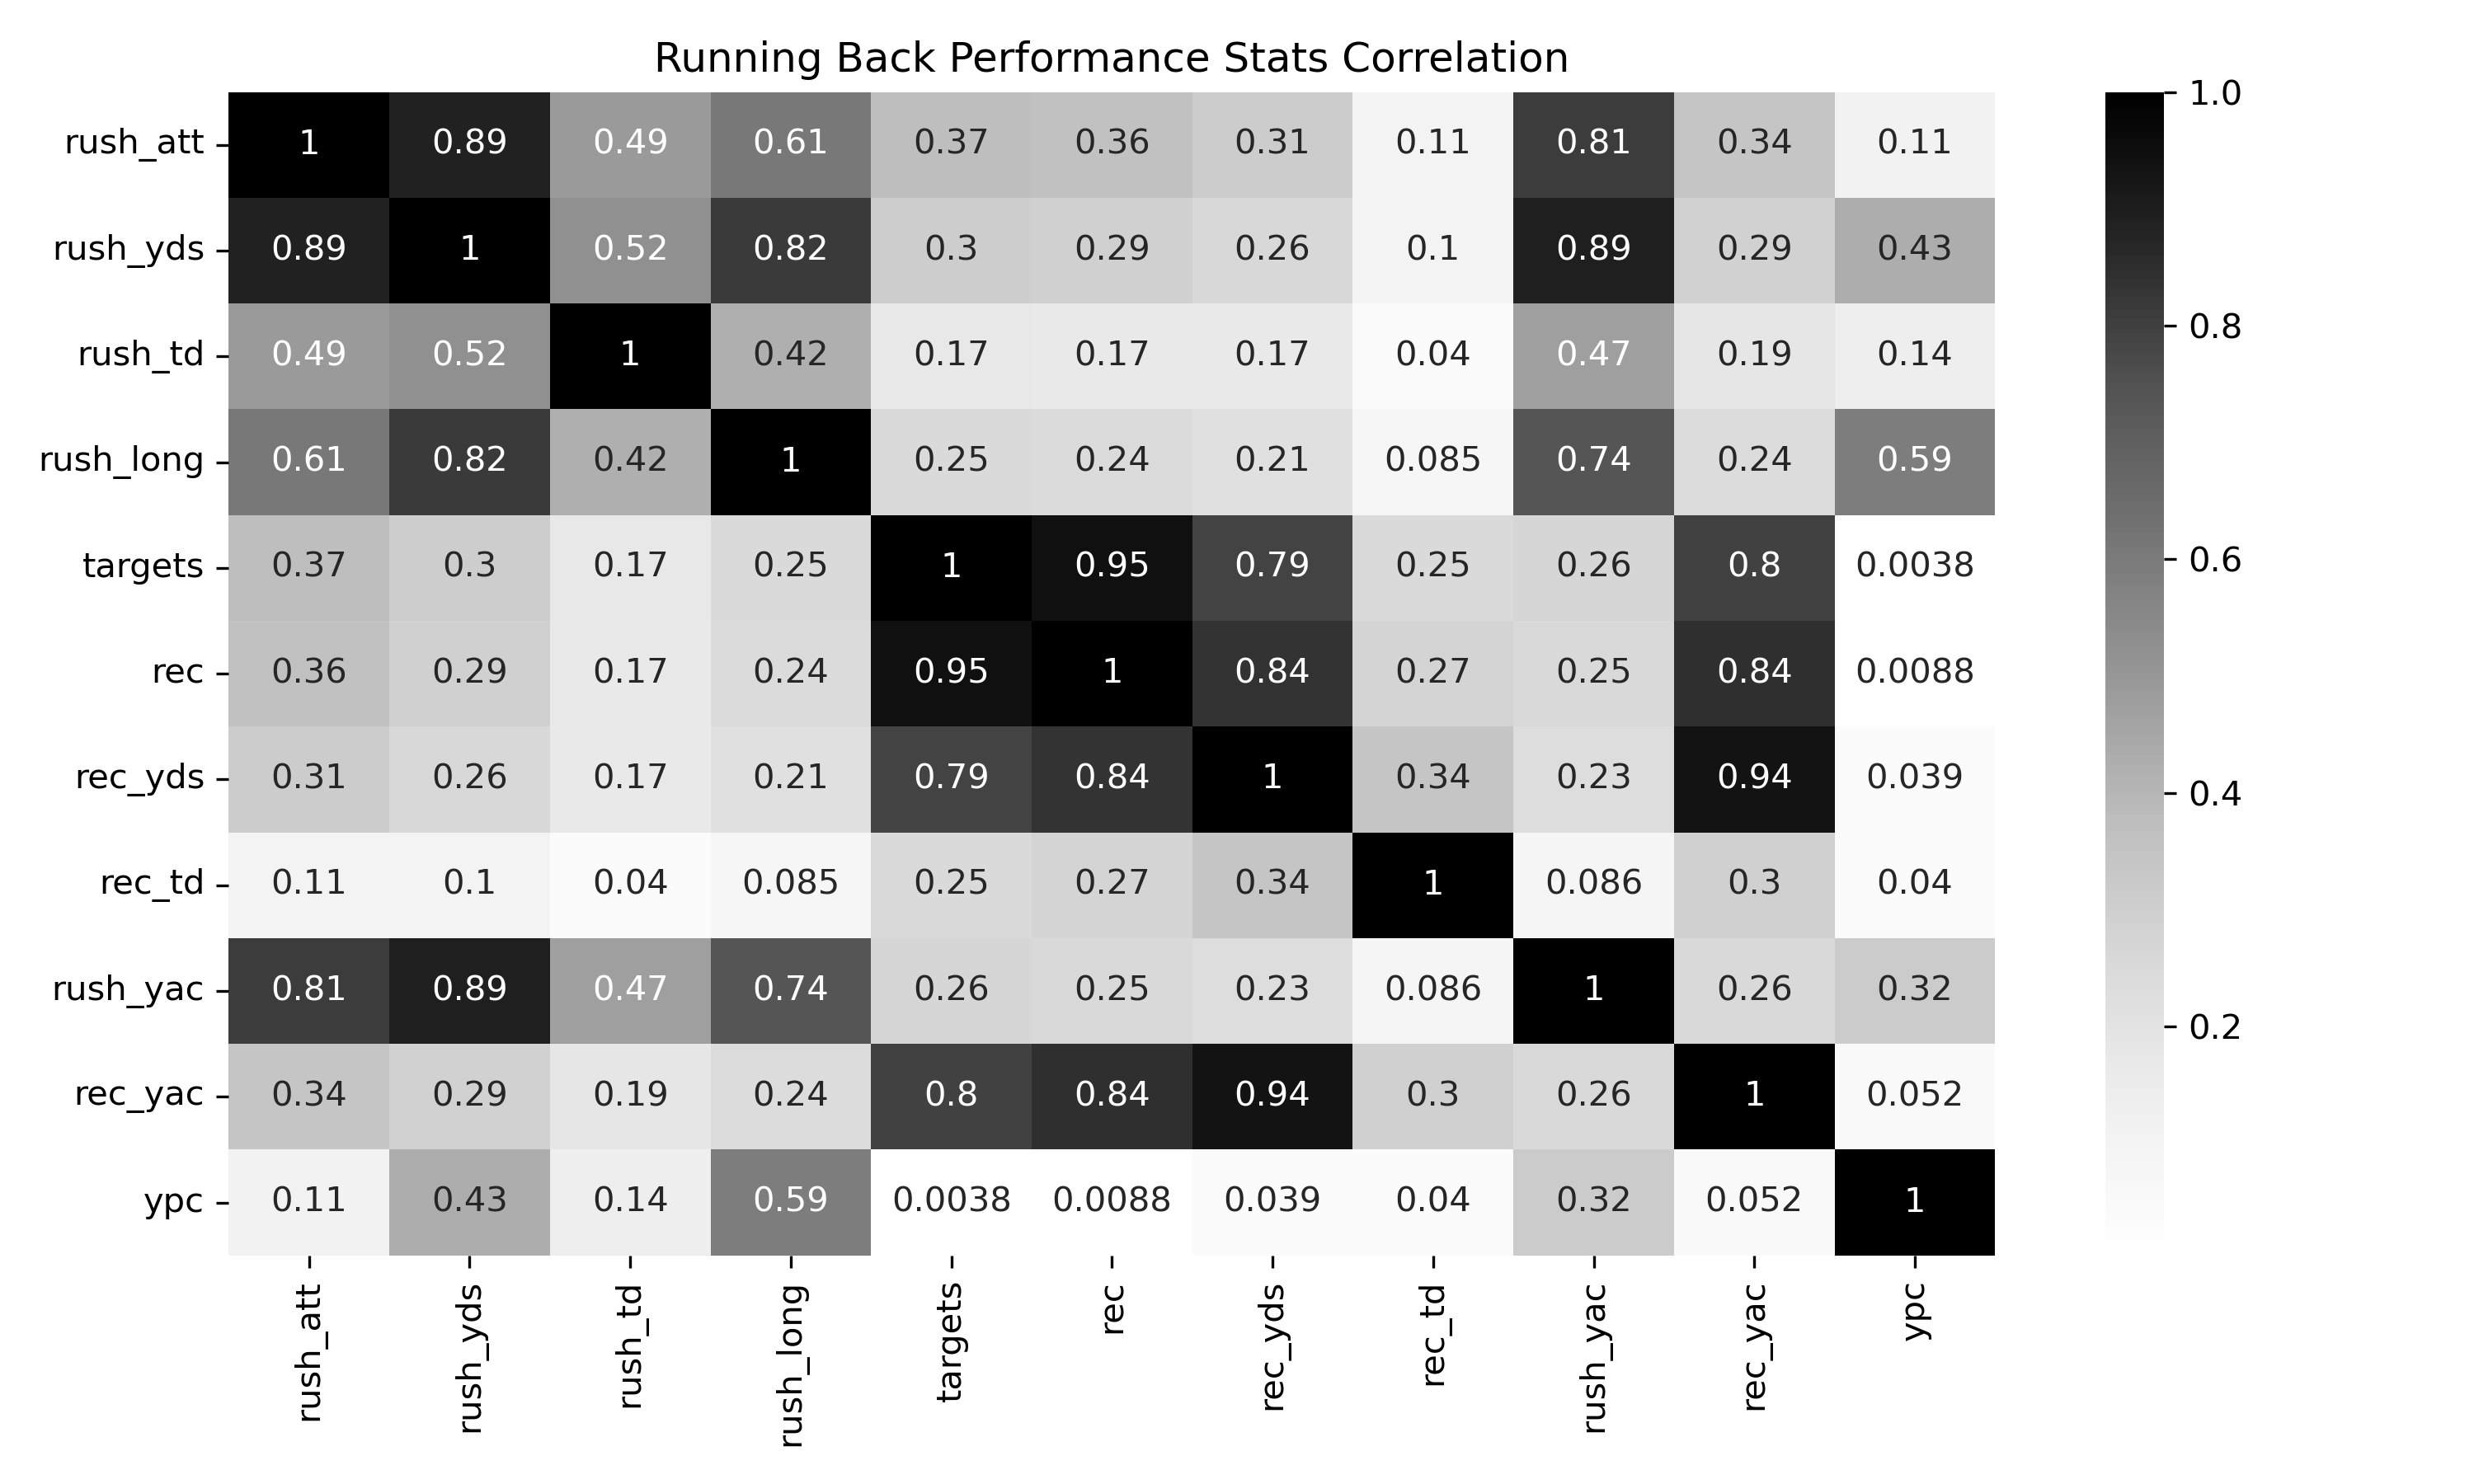
From this graph, you can clearly see that rush attempts and targets have a strong correlation with their respective efficiency stats. Rush attempts have strong correlations with rushing yards, rush longs, and rush yards after the catch. While targets almost have a 1:1 relationship with receptions (catches), reception yards, and reception yards after the catch. What I found peculiar about this graph is how relatively weak workload stats contributed to an RB’s touchdown total. Does it not make sense that the more carries and targets an RB gets, the more touchdowns they should have?
Besides some outlier performances, no, it does not look like the more rush attempts you have, the more touchdowns you average. The ethical question does arise when considering most teams do only use 1-2 running backs throughout the season. The teams that consistently use 3 or more either had their RB1 injured or have a running back committee style offense. I could just limit my study to starting RBs, but I believe that would lead to a misrepresentation of efficiency statistics throughout the NFL. In the 2019-2020 season, out of 1690 total appearances, there were only 296 games where any running back scored at least 1 rushing touchdown in a game, which is 17% of running back performances. In those 296 games, running backs averaged at least 14 carries per game. That’s above the 75th quartile (11.75 carries) in rush attempts when considering
RB performances in 2019-2020. For receiving statistics, the same kind of variation can be seen. Out of 1690 total appearances, there were only a whopping 101 games where any running back scored at least 1 reception touchdown, which is 5% of running back performances. Players who did score at least one receiving touchdown, averaged 4.3 targets per game, which is above the 75th quartile in target average for running backs in 2019-2020. This all speaks to the weak correlation that workload stats have with touchdown efficiency. Moving on to the strong correlations, I can make a conclusion that more rushing attempts and targets contribute to more yards.
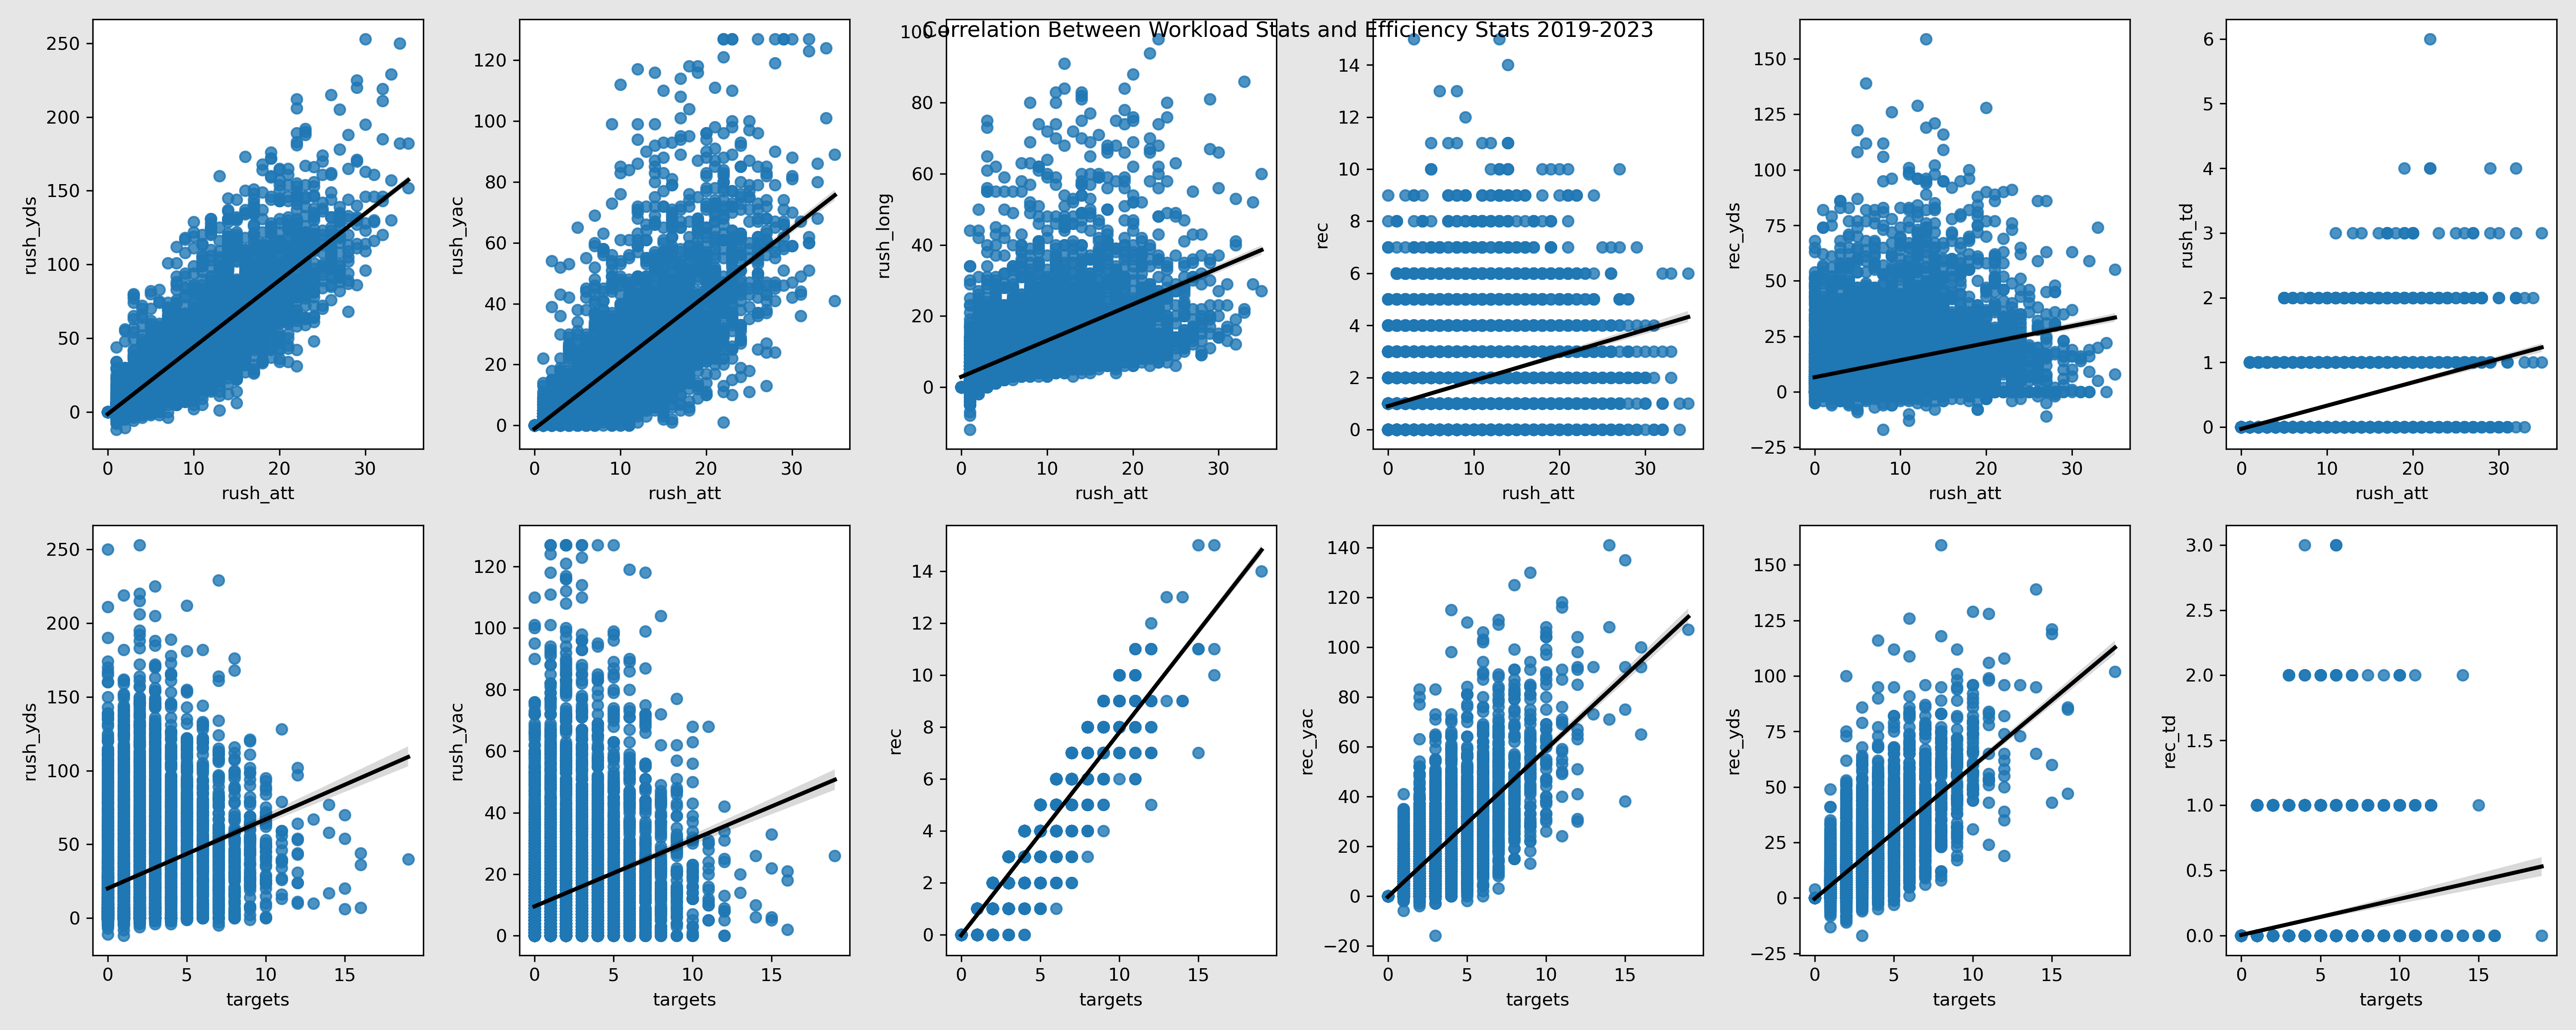
With this group of subplots, it is easier to see the strong relationship that carries have with rush yards, yards after catch, and long runs. Here are statistical tests that I performed in conjunction with the graph above.
• Carries to Rush Yards:
Slope = 4.54, R-value = 0.89, P-value = 0.0
• Carries to Rushing Yards after the Catch:
Slope = 2.19, R-value = 0.8, P-value = 0.0
• Carries to Long Runs:
Slope = 1.02, R-value = 0.61, P-value = 0.0
• Carries to Rushing Touchdowns:
Slope = 0.03, R-value = 0.48, P-value = 0.0
• Targets to Receptions:
Slope = 0.78, R-value = 0.94, P-value = 0.0
• Targets to Reception Yards:
Slope = 5.96, R-value = 0.79, P-value = 0.0
• Targets to Reception Yards after the Catch:
Slope = 5.92, R-value = 0.80, P-value = 0.0
• Targets to Reception Touchdowns:
Slope = 0.02, R-value = 0.25, P-value = 4.25
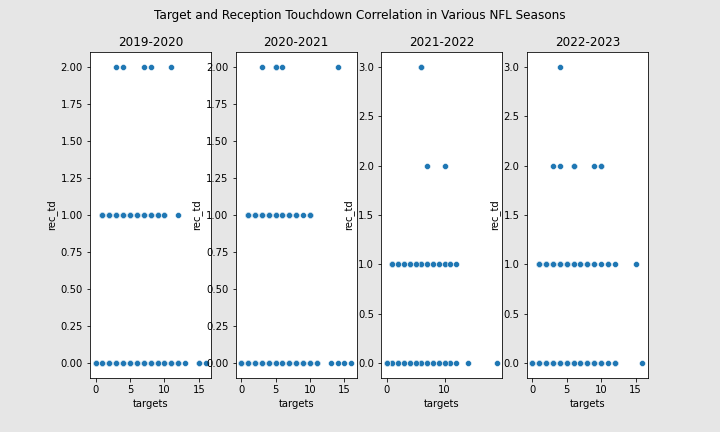
One more comment on touchdowns, I can see that the P-value for carries to rushing touchdowns suggests the rejection of the null hypothesis. On the other hand, the P-value for targets to receiving touchdowns strong suggests that there is no correlation, even when they share similar slopes. It makes sense since only 25% of running backs average over the 75th quartile in average targets from 2019-2023. However, every other statistical test does make the case that an RB’s production mostly boils down to how many yards can they push the ball down the field. From this point on, I felt comfortable to start making production profiles for individual running backs.
5
Based on the correlations that I found, would I be able to contextualize a player’s spikes, dips, and stability in their production? The first player whose profile I decided to make was Christian McCaffrey’s, currently of the San Francisco 49ers.
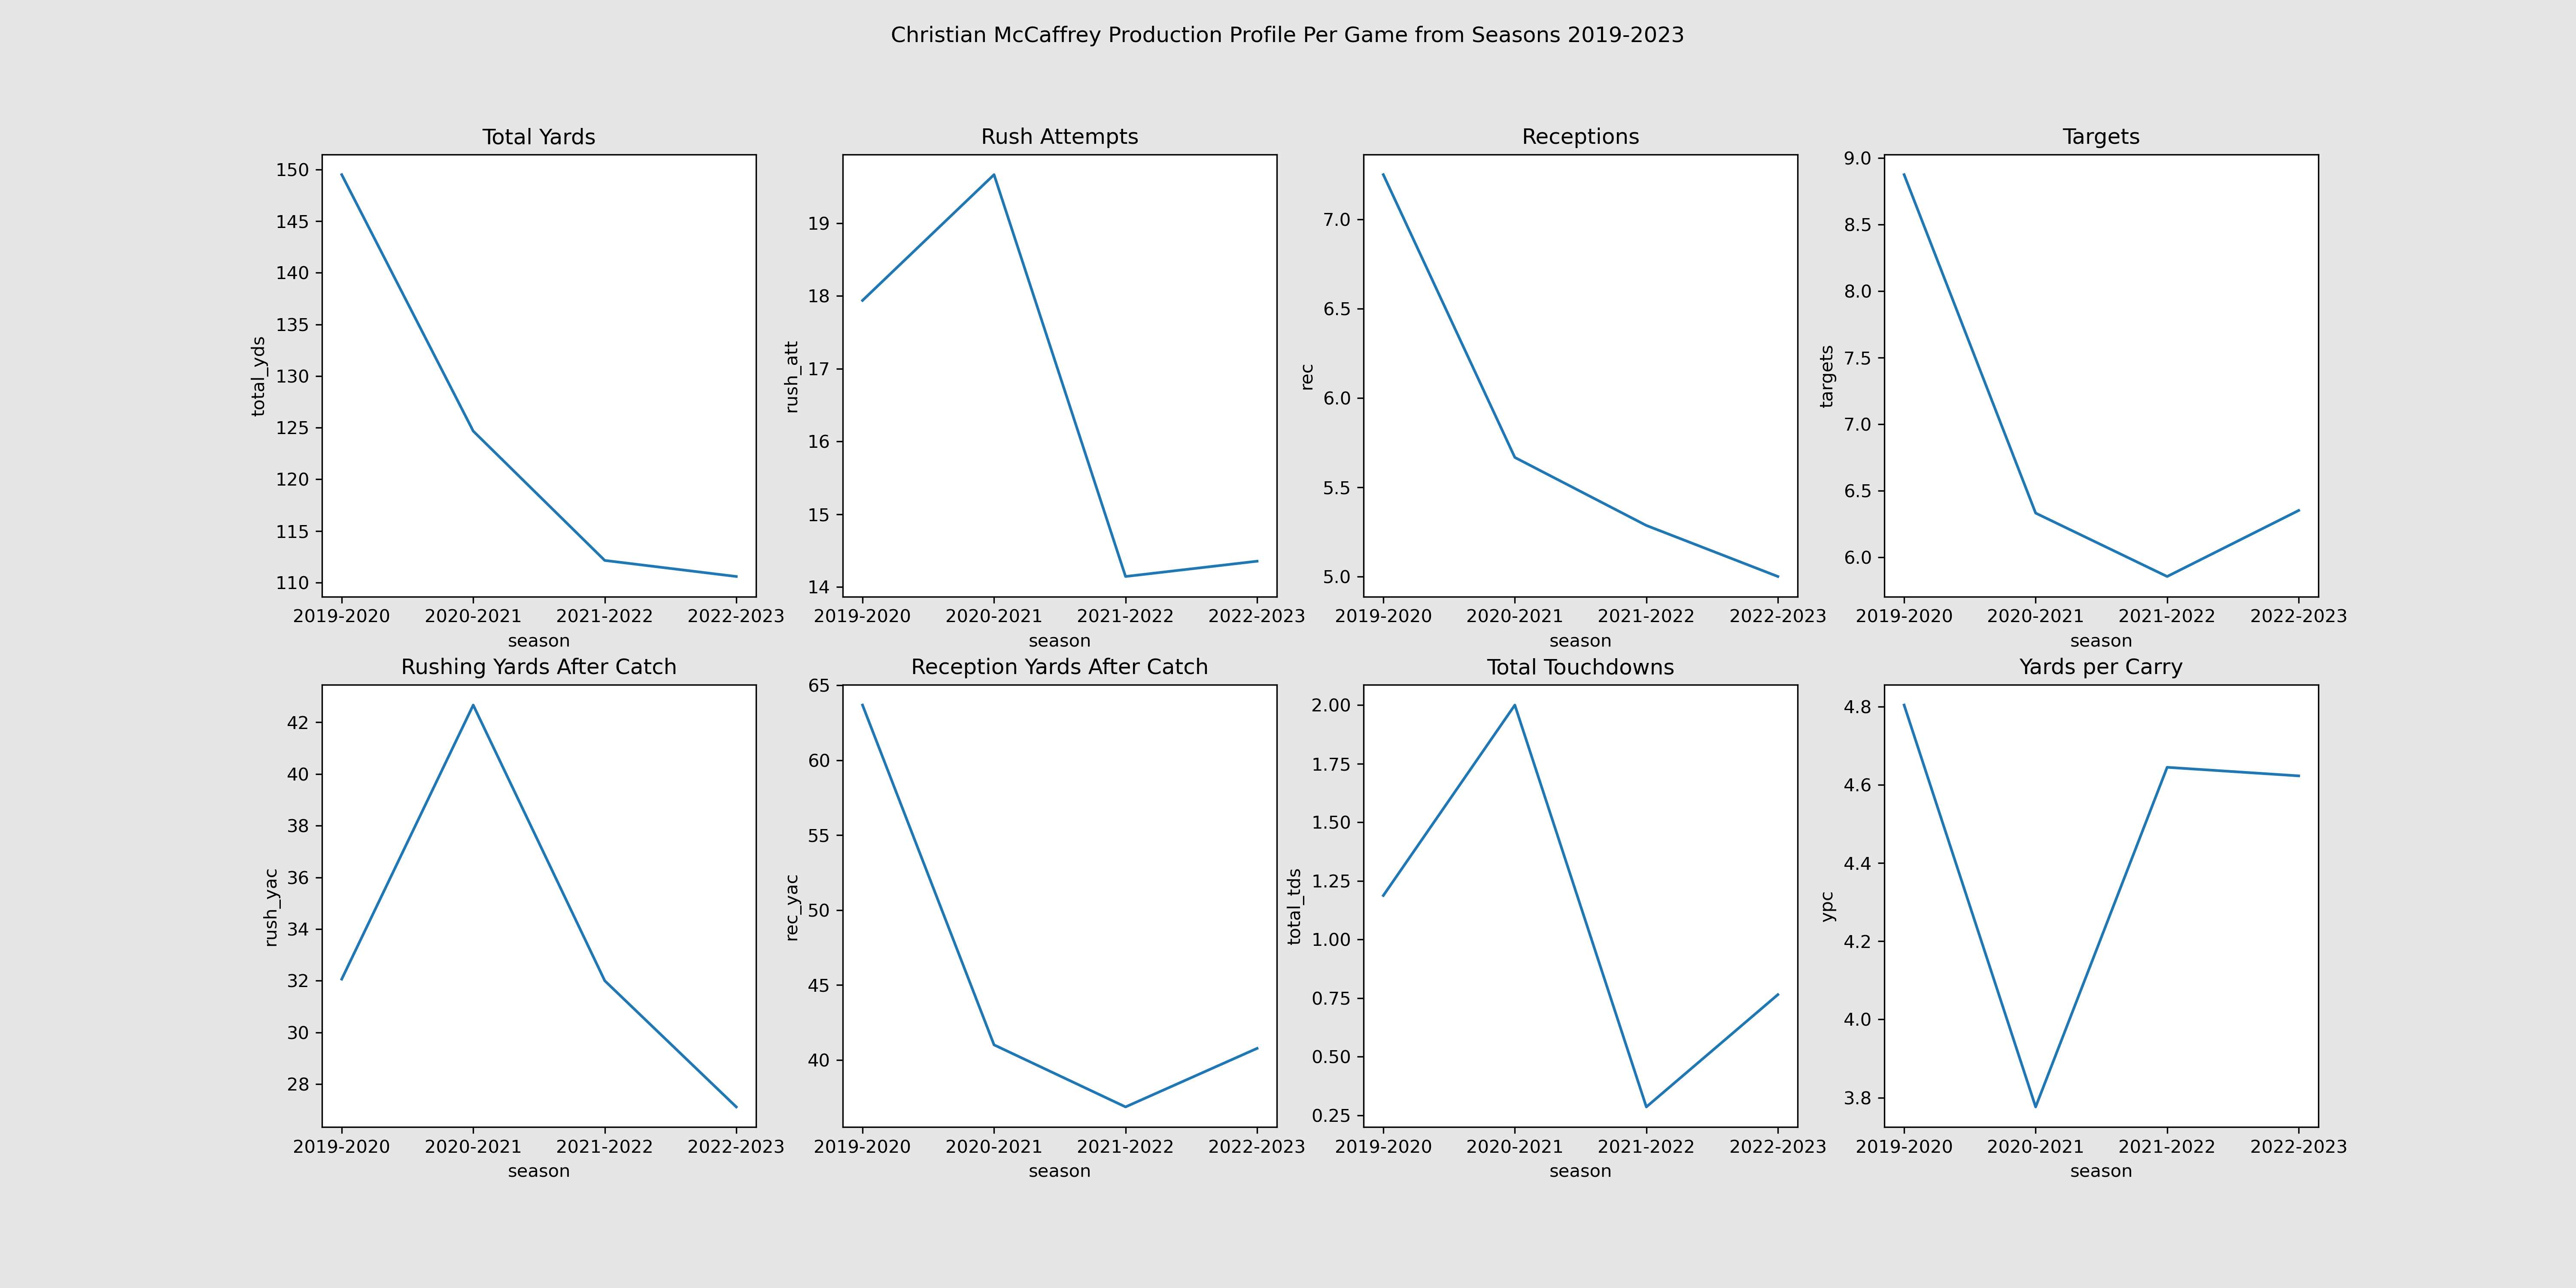
Here are observations we can make from our subplots:
• Total yards per game has a massive dip after 2019-2020 until a bit of a stabilization in
2022-2023
• Rush attempts per game also have a dip after the 2020-2021 season with increase in
2022-2023
• Targets per game also have a dip after the 2019-2020 season with stabilization and
increase in 2022-2023
• Other efficiency stats such as receptions, targets, rushing yards after catch, reception
yards after catch, and yards per carry all have a dip and then stabilize in 2022-2023
Based on domain knowledge, this profile does correlate with his injury history and team change. His high ankle sprain, strained hamstring, and shoulder injuries caused him to only play 10 games in total between the 2020-2021 and 2021-2022 season. Therefore, his rush attempt per game does appear to have a spike in 2020-2021 since his season was only contained to 7 games. When he finally has a healthy season in 2022-2023, his workload and efficiency stats either begin to stabilize or even rise. However, it is unusual for somebody that has essentially missed two entire seasons of football, to immediately stabilize or even bump his production up. Since, Christian McCaffrey himself is an outlier player on his own, I do think it would be a misrepresentation of the average starting RB, to quantify his return to form. However, his trade from the Carolina Panthers to the San Francisco 49ers, in the middle of the 2022-2023 season, begs for further investigation. According to ESPN, In the 2022-2023 season, the Carolina Panthers were the 29th ranked offense in the NFL. On the other hand, the San Francisco 49ers were the 5th ranked offense in the NFL. This motivates the question of how his teammates’ production affected his efficiency.
Let’s answer that question by creating, Minnesota Vikings RB1, Dalvin Cook’s production profile.
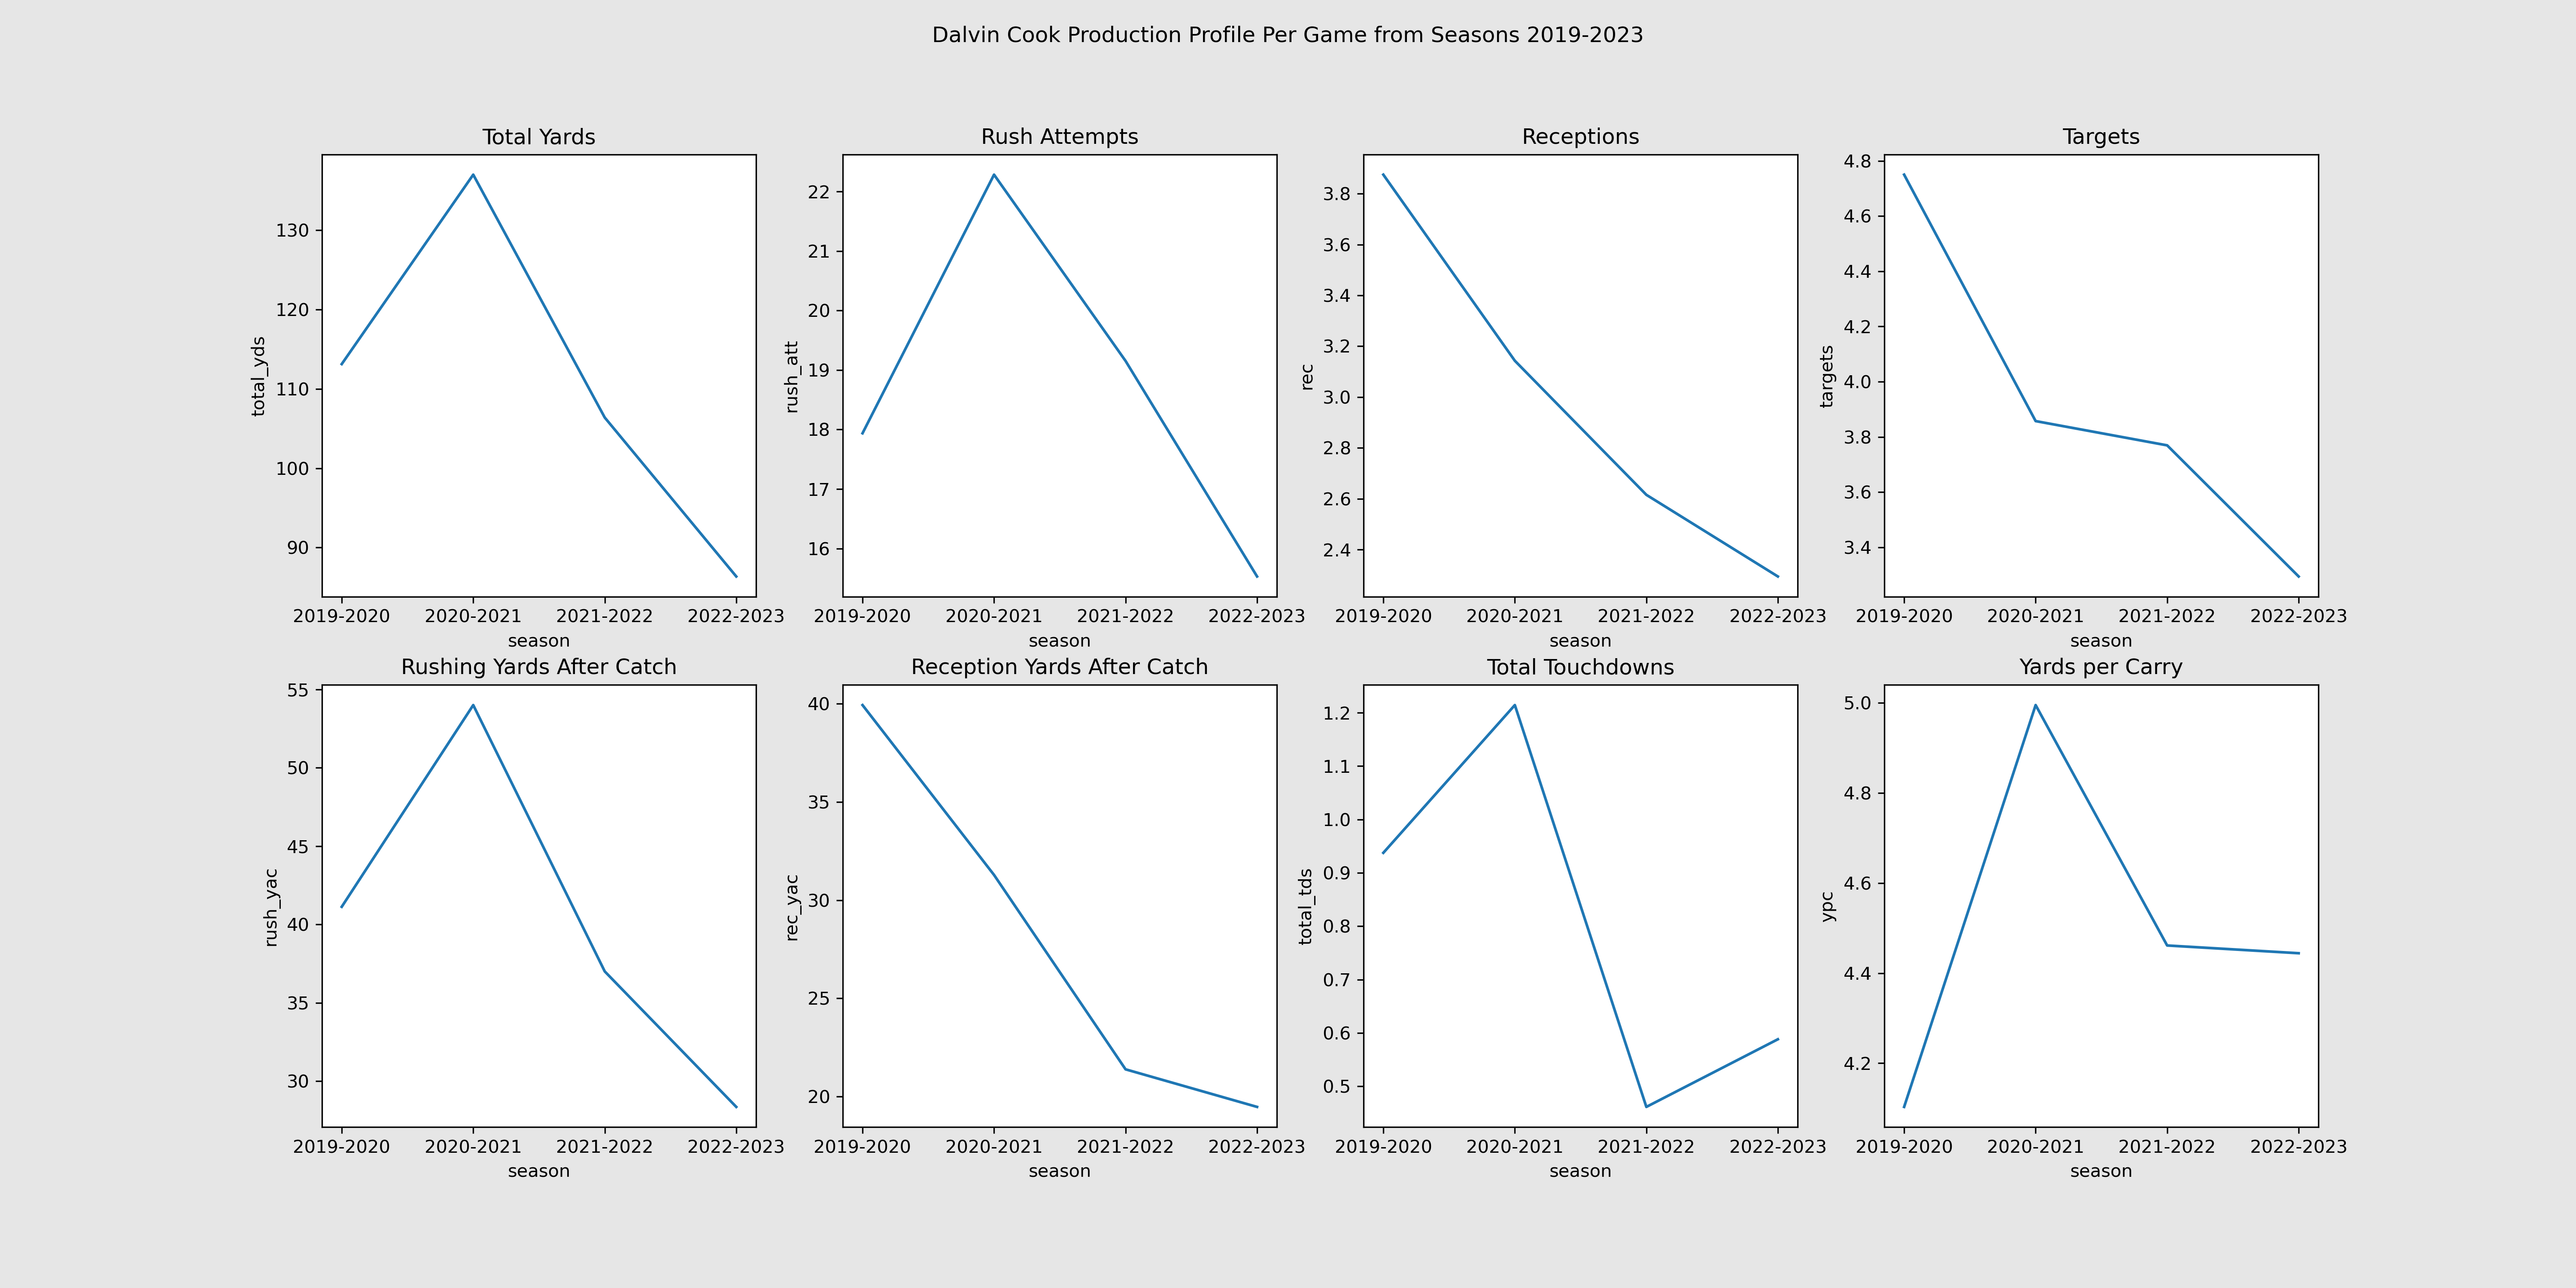
With no major injury history and trade that majorly affects Cook’s production, we can better see other reasons for his continual plunge as the years go on.
• Total yards per game has a 21% increase in 2020-2021 but decreases 22% the next season, then by another 18% in 2022-2023
• Rush Attempts has a similar pattern in change over the 4 seasons
• Targets per game decreases every year
• Other efficiency stats such as receptions, rushing yards after catch, reception yards after
catch, and yards per carry all start to decrease
Dalvin Cook, like McCaffrey, is a pass catching running back. 30% of his total yardage over
4 seasons in the NFL, are reception yards. During our earlier analysis, we know that receptions and reception yards have a strong R-value of 0.84. Therefore, we can see why as his targets and receptions go down, his total yardage also goes down. Can we fault this steep decline in workload and efficiency to his wide receivers? Before we do that, let’s take a quick look at wide receiver workload and efficiency stats correlation.
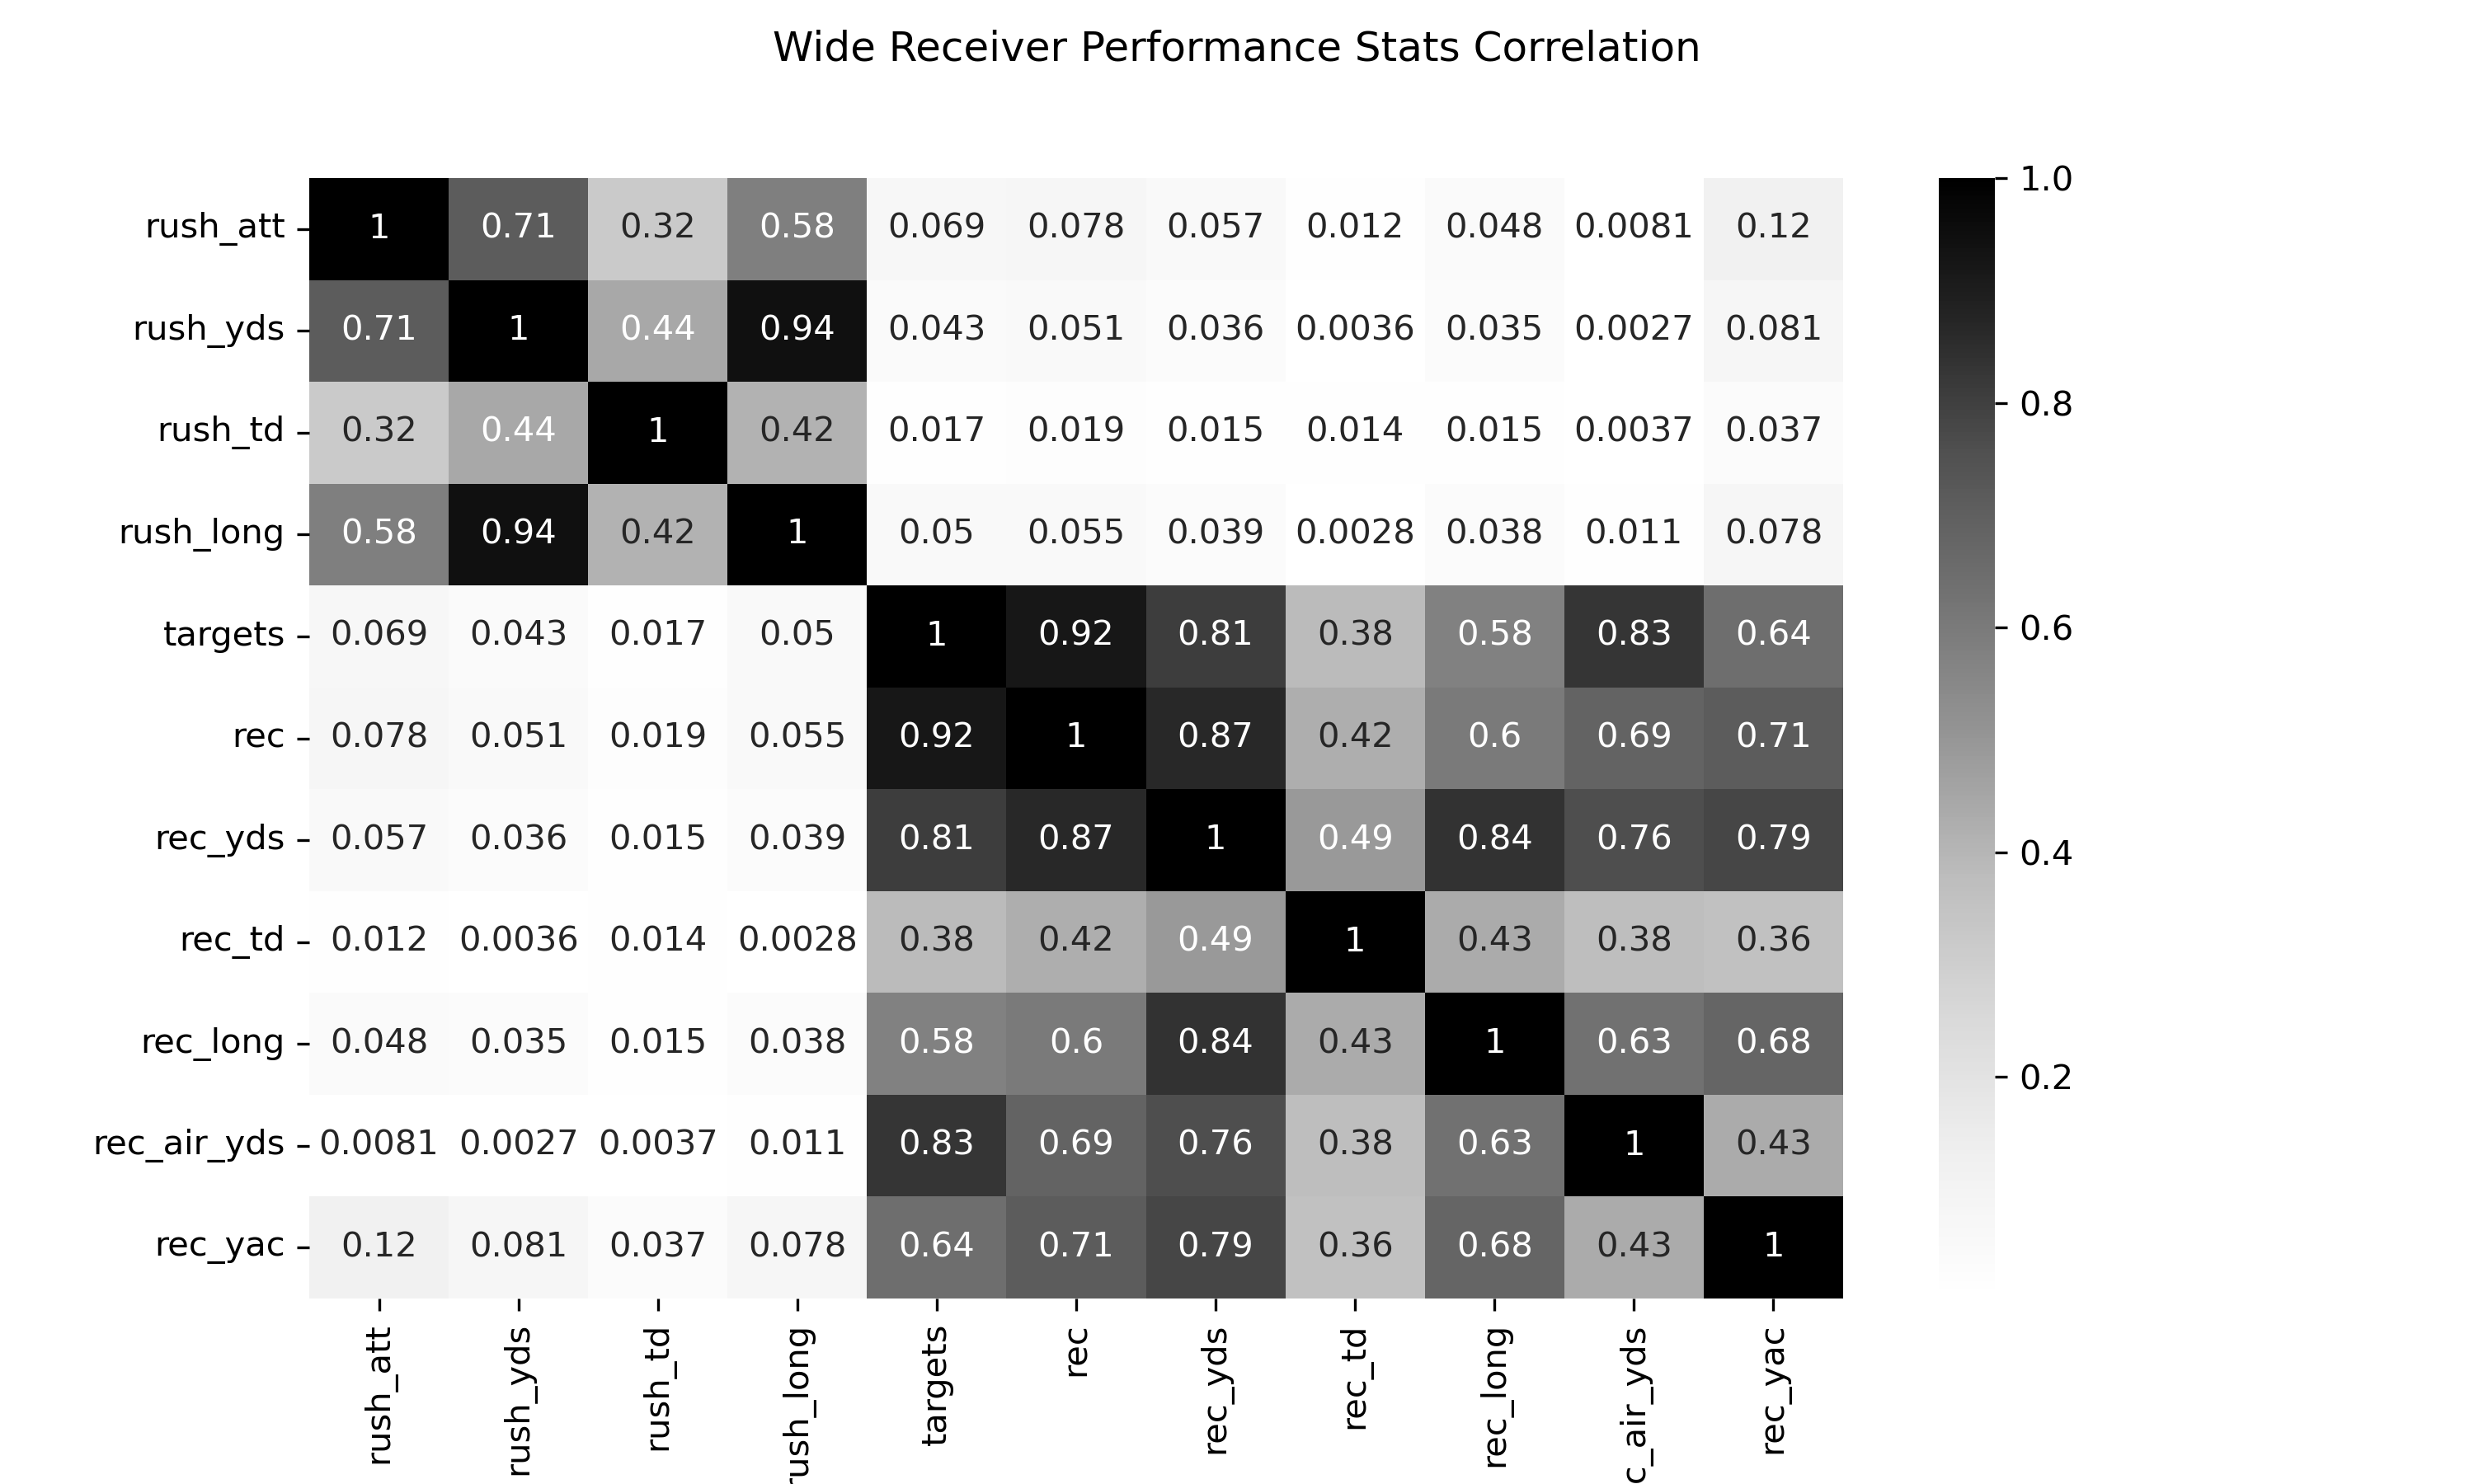
Wide receivers catch the ball more than running backs therefore, they also have a strong correlation with their target share and efficiency stats such as receptions, reception yards, air yards, and yards after catch. Now that we know that wide receivers have the same relationship between their workload and efficiency stats. Let’s look at Dalvin Cook’s target share compared to his other receivers’ target percentage over the years.
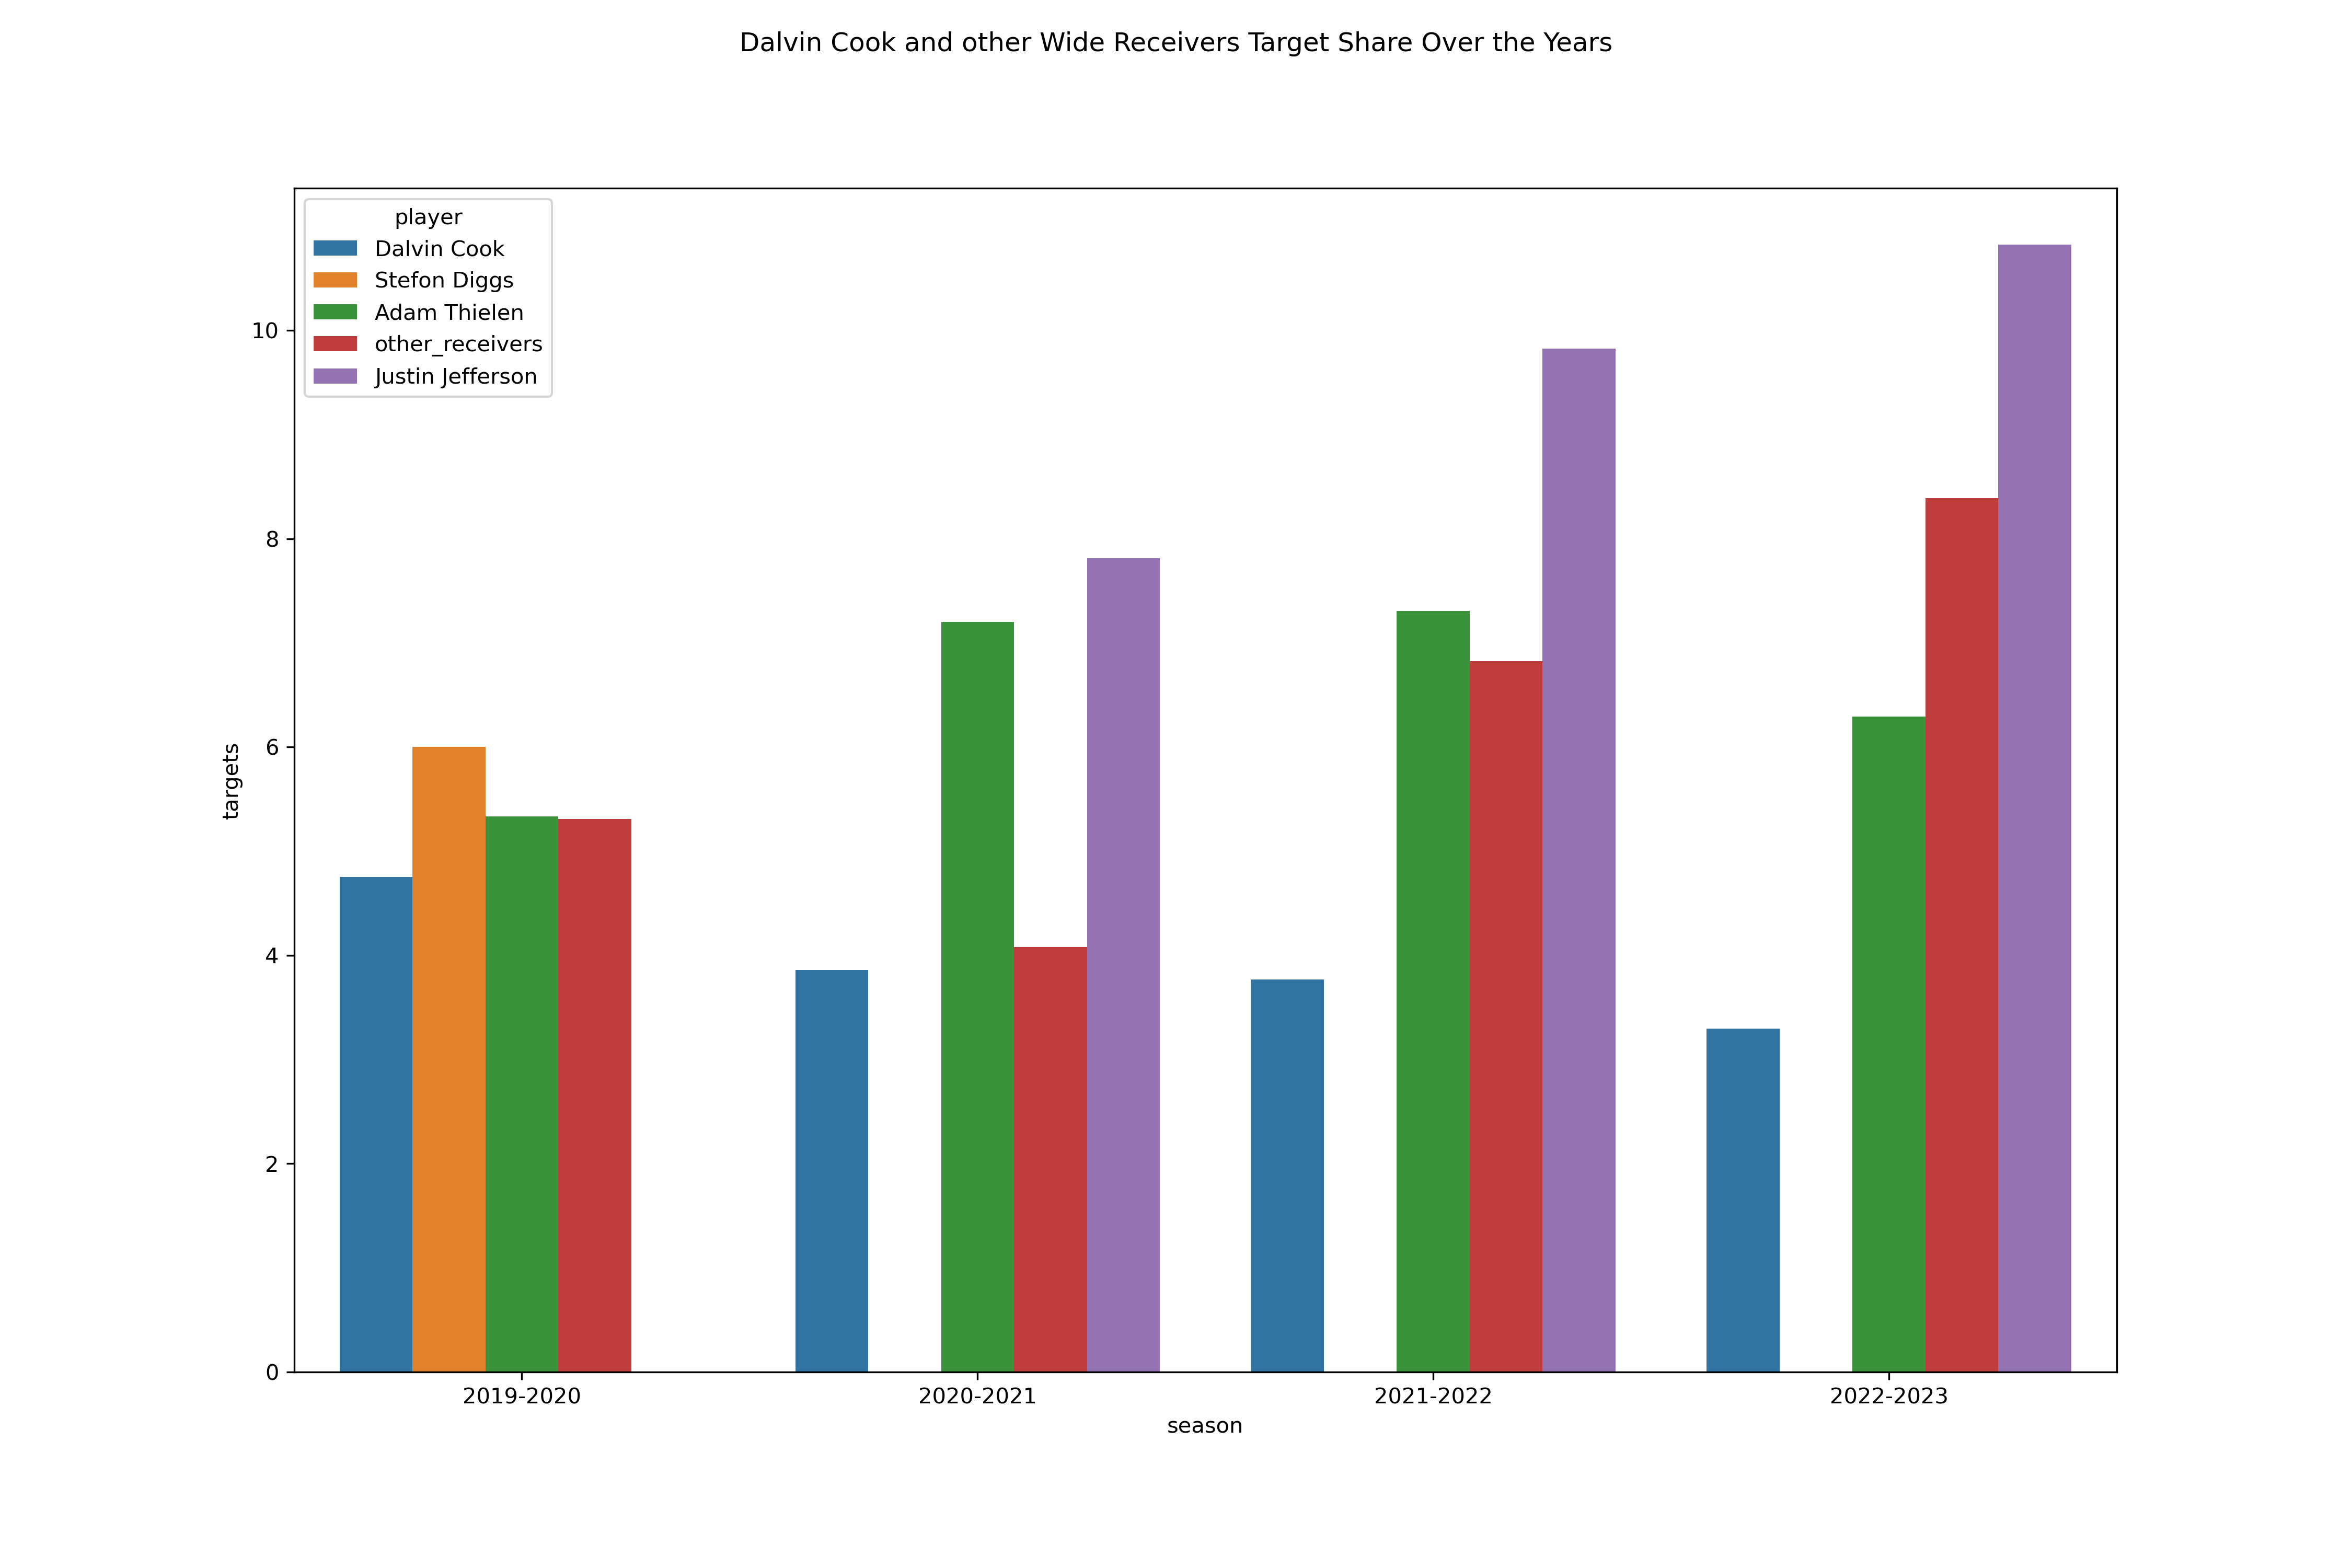
My suspicion in wide receiver production affecting running back production is starting to come into fruition. For the first season, we see the target share between Dalvin Cook and his other receivers’, distributed relatively evenly. Stefon Diggs slightly dominates the target percentage with Adam Thielen and other receivers having the 2nd larger share. Keep in mind, this is the year where his reception statistics are at their highest. By the next season, Stefon Diggs has
been traded. He is replaced by a first-round future star wide receiver from LSU in Justin Jefferson. He immediately takes over and starts to demand a bigger share in the target percentage. Even Thielen starts to have a bigger share in pass plays. On the other hand, Cook’s rushing attempts and targets per game start decrease as Jefferson’s targets increase. Can we quantify the relationship between wide receiver production negatively affecting running back production?
To quantify this relationship, I took three random starting running backs’ attempts per game and compared them to their teammates’ targets per game for each season. The three running backs I chose were Dalvin Cook, Ezekiel Elliott from the Dallas Cowboys, and Derrick Henry from the Tennessee Titans.
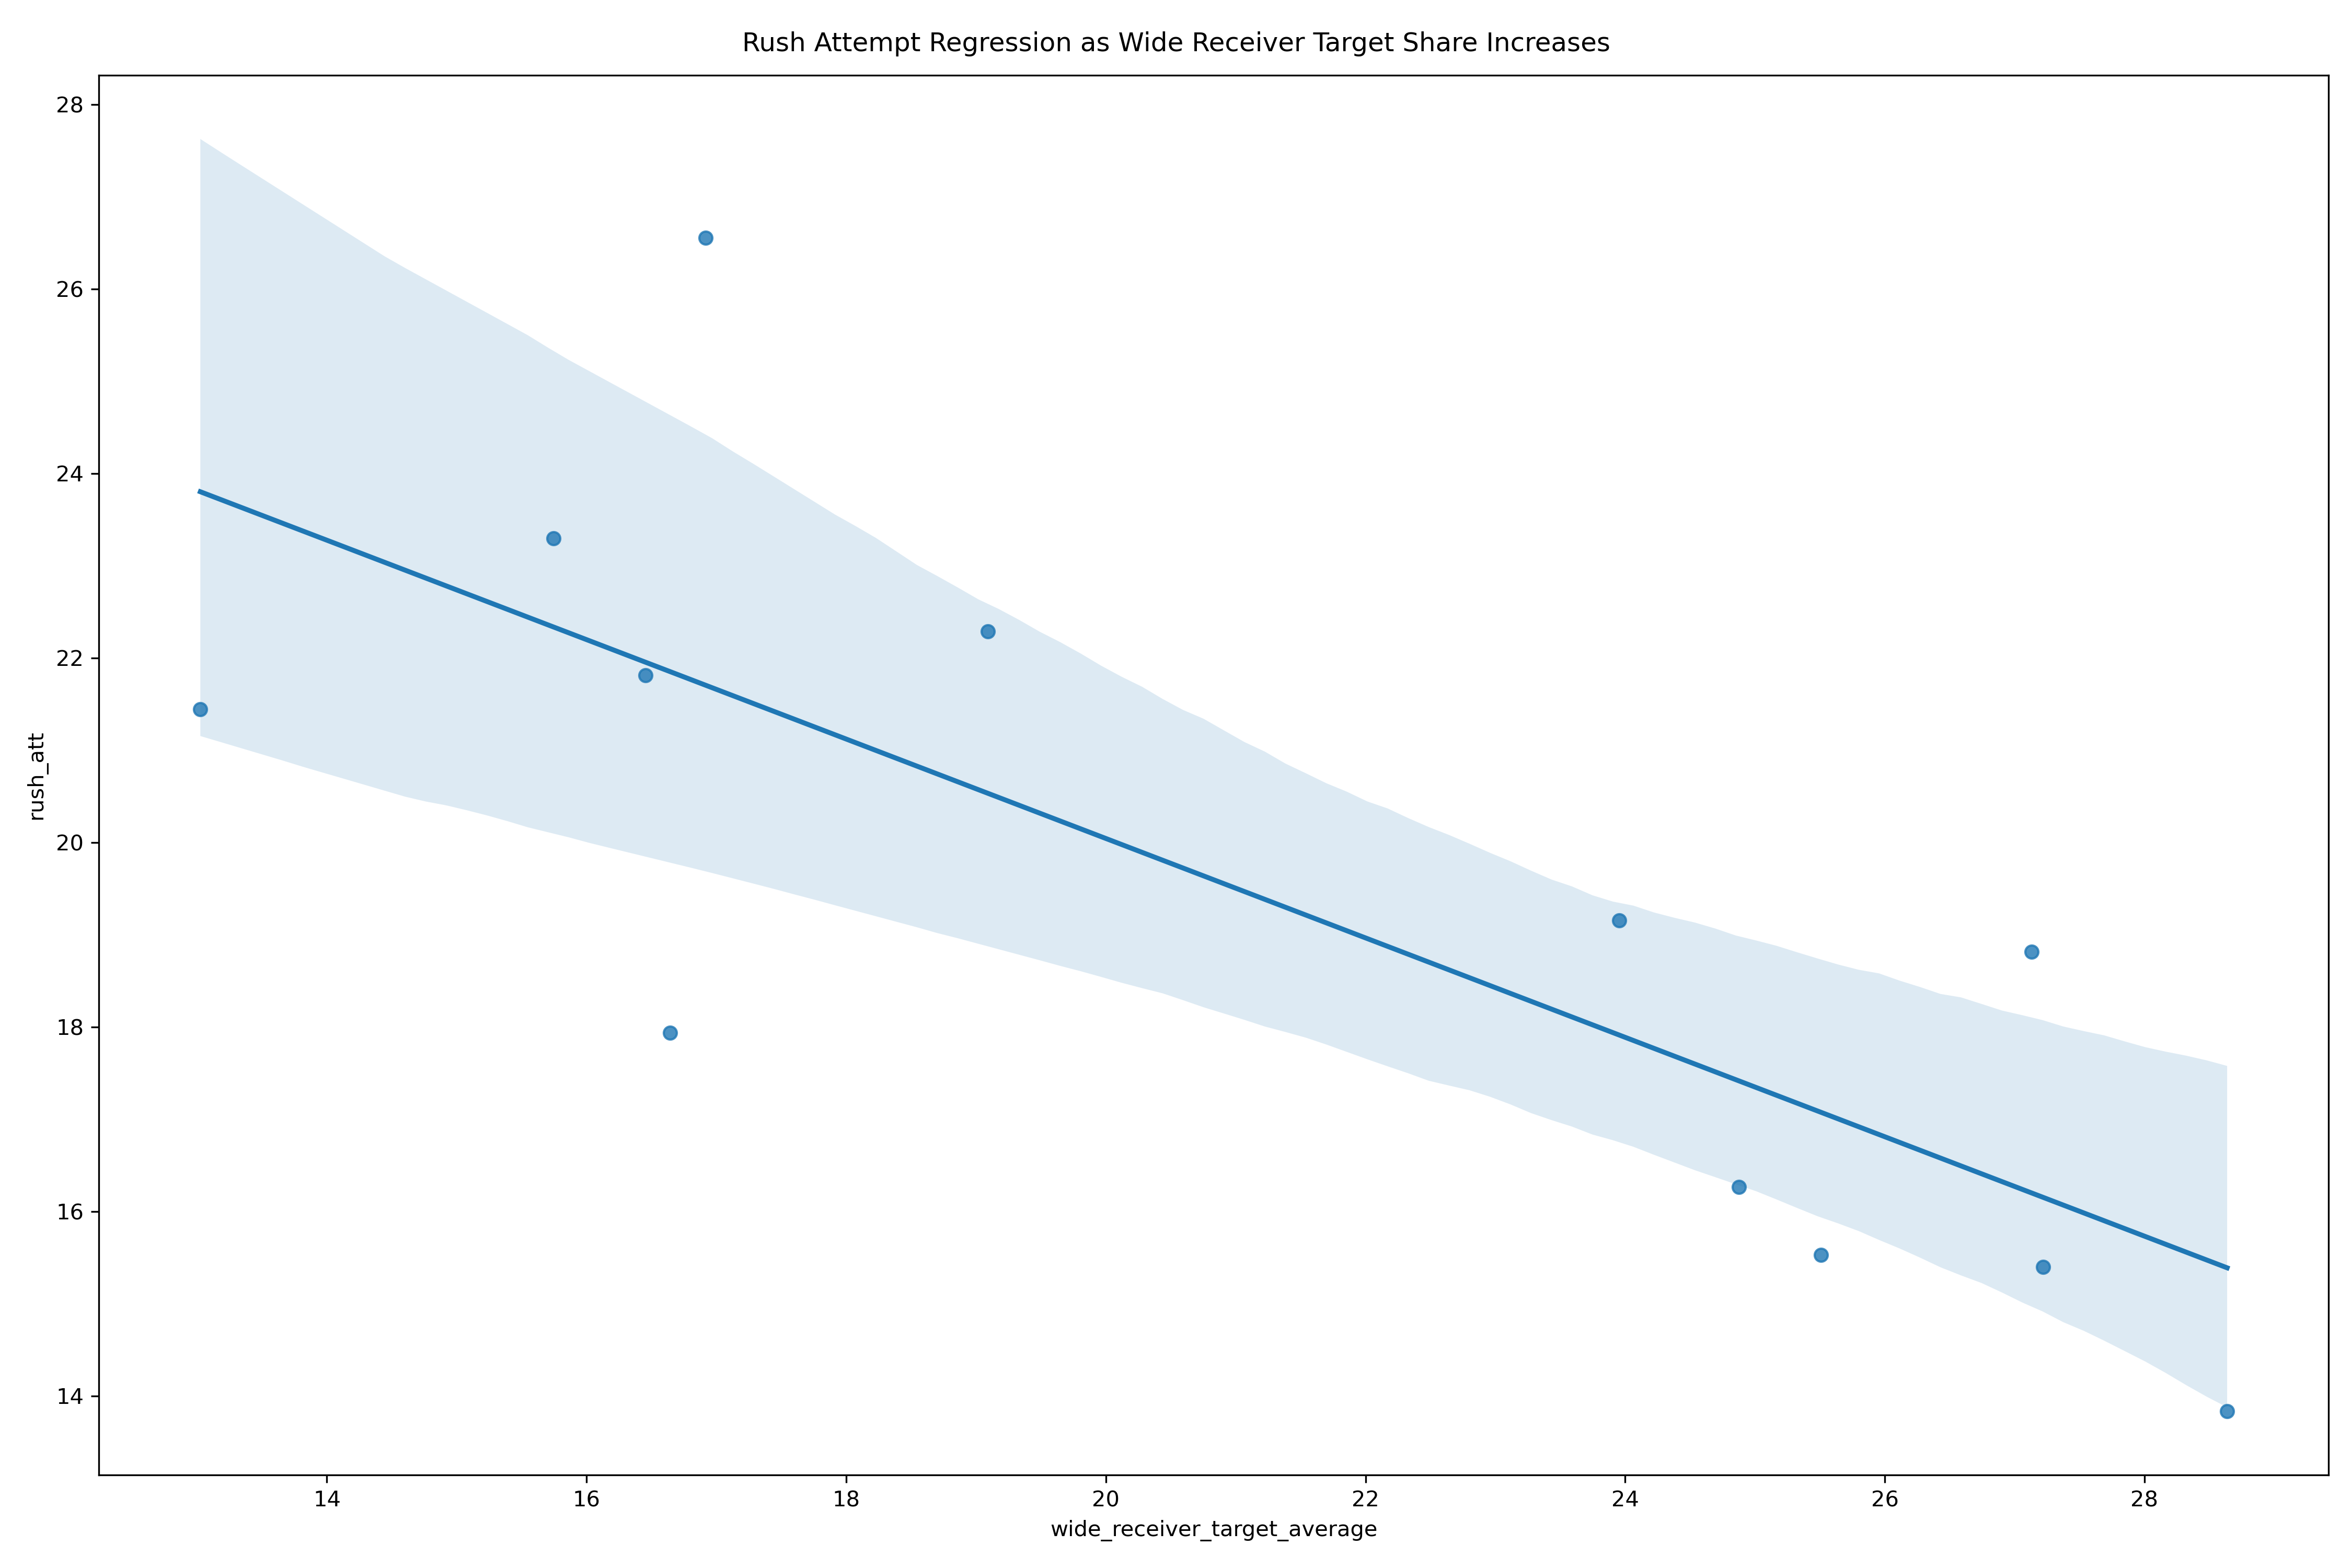
Even if this subset only consists of 3 teams in total, this subset is still big enough to be able to do statistical testing and infer that this relationship is representative of even more teams’ running back and wide receiver production.
• Slope = -1.1, R-value = 0.78, P-value = 0.003
A P-value of 0.003 allows me to reject the null hypothesis of there being no relationship
between wide receiver targets and running back rush attempts. The slope suggests that for every increase of 1 in total receivers’ targets, rush attempts decrease by 1.1.
All in all, we were able find various reasons for inconsistencies in running back production. I took Christian McCaffrey’s performance profile and was able to contextualize his profile due to his injury history. His trade from a bottom ranked offensive team to a top ranked offensive team sparked for further investigation since his immediate return to producing high efficiency stats were unusual for somebody to have missed almost two seasons of football. Therefore, I made a production profile for Dalvin Cook, who has less of a major injury history and was not traded to a completely new team, leading to less variables to worry about. After seeing Dalvin Cook’s workload continually sink, I made a hypothesis that there was a negative correlation between a team’s wide receiver workload and a running back’s workload. First, I made a correlation graph to prove the correlation of a wide receiver’s workload with his efficiency. Statistical testing showed a strong relationship between targets and receptions. We also saw a strong correlation with receptions and reception yards. Therefore, I made a graph that showed how as Dalvin Cook’s target percentage went down, his receivers’ targets per game went up, which also explains why Cook’s efficiency and workload stats continually go down. Finally, to quantify this relationship, I took 3 individual running rush attempts over 4 seasons and found how they correlate with their receivers’ target numbers. Through the graph I made, I was able to confirm a negative linear regression. With a negative slope of 1.1 and a P-value of 0.03, the null hypothesis can be rejected, and it can be confirmed that there is indeed, a negative relationship between a running back’s and a wide receiver’s production. This relationship gets even deeper when you start to consider that not only wide receivers can be pass catchers. Tight ends can also take targets and carries away from a running back’s workload. Further investigation can also be done by looking at how a quarterback’s tendencies can affect a running back’s production. A team’s offensive line efficiency can also affect the running back. If we really wanted to stretch this, we could even look at how the opposing team’s defensive efficiency affects the running back, vice versa. These relationships can all be derived with the dataset that I selected. Studies like this could essentially be used to help a team find areas of their game that they need to improve on, such as, do they need to spend high draft capital to build on a certain area of the team? Alternatively, an analyst working for another team may do a study like this to identify weaknesses in the opponent team. Therefore, in an ethics conversation, this kind of data can be used to cause harm in a competitive sports setting. Which is why I imagine several NFL teams keep certain advanced analytics, that they derived on their own, away from the public eyes. This project really opened my mind in terms of the nuance of how many moving parts there are in NFL football. When you consider how many relationships there are between offense, defense, special teams, personnel, and even general management, you can make a strong argument in considering football as the most team-oriented sport of all.