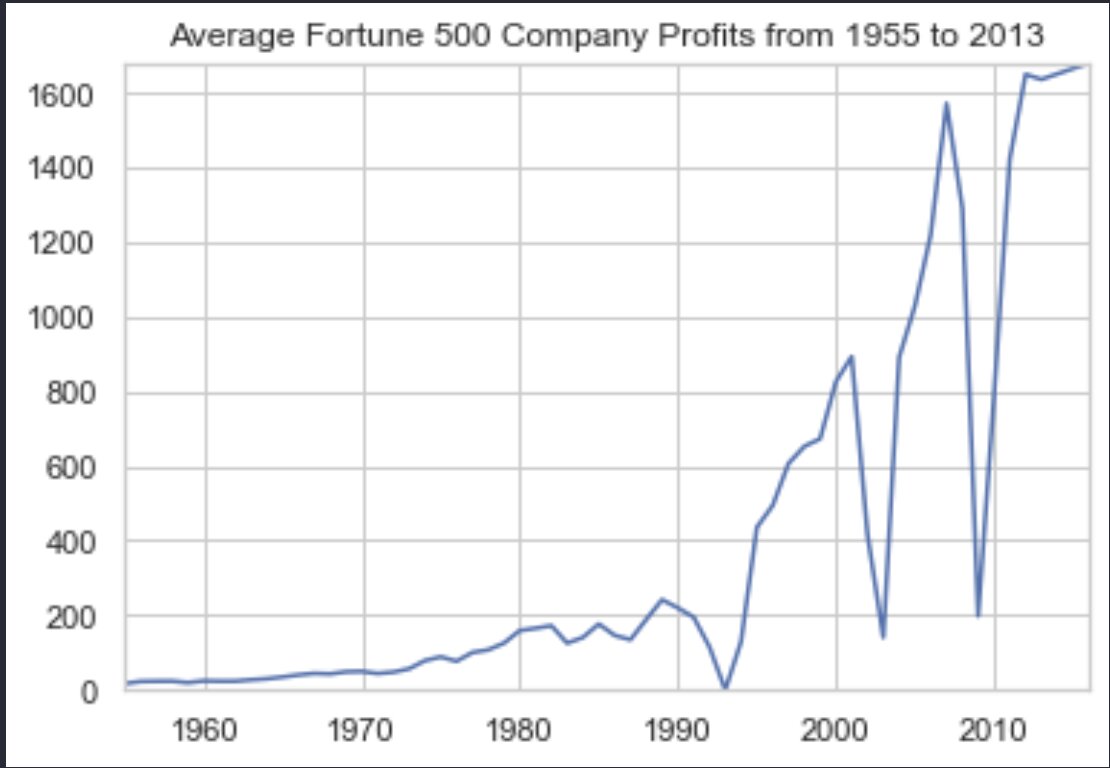
For my first data science analysis, I decided to take a data set consisting of 30,000 fortune 500 companies,
ranging from the year 1955 to 2005, and find any meaningful trends in terms of profit and revenue as time goes on.
The Jupyter notebook that contains all the Python code and Matplotlib utlization, can be found here. I used this csv file to produce my findings.