So I found this dataset containing exoplanet discoveries from 1989 to 2014. Here’s a list of exploratory questions that I answered to get a better understanding of what’s going on in this dataset.
- How many exoplanets are missing values for all 3 planet characteristics at once (mass, orbital
period, and distance)?
- Were there any years between 1989 and 2014 where no exoplanets were discovered?
- Out of the 3 most common discovery methods, which appears to be the most capable of finding
faraway exoplanets?
- What is the average distance of exoplanets whose mass is known? What is the average distance
of exoplanets whose mass is unknown?
- Which exoplanet discovery method is responsible for the most missing mass values?
import pandas as pd
df = pd.read_csv('exoplanets.csv')
df
| method |
number |
orbital_period |
mass |
distance |
year |
| Radial Velocity |
1 |
269.3 |
7.1 |
77.4 |
2006 |
| Radial Velocity |
1 |
874.774 |
2.21 |
56.95 |
2008 |
| Radial Velocity |
1 |
763 |
2.6 |
19.84 |
2011 |
| Radial Velocity |
1 |
326.03 |
19.4 |
110.62 |
2007 |
| Radial Velocity |
1 |
516.22 |
10.5 |
119.47 |
2009 |
| Radial Velocity |
1 |
185.84 |
4.8 |
76.39 |
2008 |
| Radial Velocity |
1 |
1773.4 |
4.64 |
18.15 |
2002 |
| Radial Velocity |
1 |
798.5 |
nan |
21.41 |
1996 |
| Radial Velocity |
1 |
993.3 |
10.3 |
73.1 |
2008 |
| Radial Velocity |
2 |
452.8 |
1.99 |
74.79 |
2010 |
How many exoplanets are missing values for all 3 planet characteristics at once (mass, orbital
period, and distance)?
Before I fully do the proper slicing to find how many of these entires from the dataframe have missing values for the three main columns, I just want to get an idea of how many missing values I’m dealing with as a whole.
RangeIndex: 1035 entries, 0 to 1034
Data columns (total 6 columns):
| column |
Non-Null Count |
Dtype |
| method |
1035 non-null |
object |
| number |
1035 non-null |
int64 |
| orbital_period |
992 non-null |
float64 |
| mass |
513 non-null |
float64 |
| distance |
808 non-null |
float64 |
| year |
1035 non-null |
int64 |
df[(df['orbital_period'].isnull() & df['mass'].isnull() & df['distance'].isnull())]
| method |
number |
orbital_period |
mass |
distance |
year |
| Imaging |
1 |
nan |
nan |
nan |
2008 |
| Imaging |
1 |
nan |
nan |
nan |
2006 |
| Transit Timing Variations |
3 |
nan |
nan |
nan |
2014 |
| Microlensing |
1 |
nan |
nan |
nan |
2008 |
| Microlensing |
1 |
nan |
nan |
nan |
2008 |
| Microlensing |
1 |
nan |
nan |
nan |
2009 |
| Microlensing |
1 |
nan |
nan |
nan |
2010 |
| Microlensing |
1 |
nan |
nan |
nan |
2004 |
| Microlensing |
1 |
nan |
nan |
nan |
2009 |
| Imaging |
1 |
nan |
nan |
nan |
2010 |
| Imaging |
1 |
nan |
nan |
nan |
2008 |
Here we can see the 11 total discoveries that had orbital period, mass, and distance as unknown values.
Were there any years between 1989 and 2014 where no exoplanets were discovered?
So I’d like to attack this problem with some simple Python. I’d like to put the years (1989 - 2014) in a set. I would also like to put all the unique values, in the ‘year’ column from the dataframe, into a set. Then, from there I can just compare values that are in the (1989 - 2014) set, that aren’t in the unique values set.
years_column_set = set(df['year'].unique())
years_set = set(range(1989, 2015))

years_set.difference(years_column_set)

>>> {1990, 1991, 1993}
Strangely, there were no planets found in almost a 4 year span between 1990 and 1993.
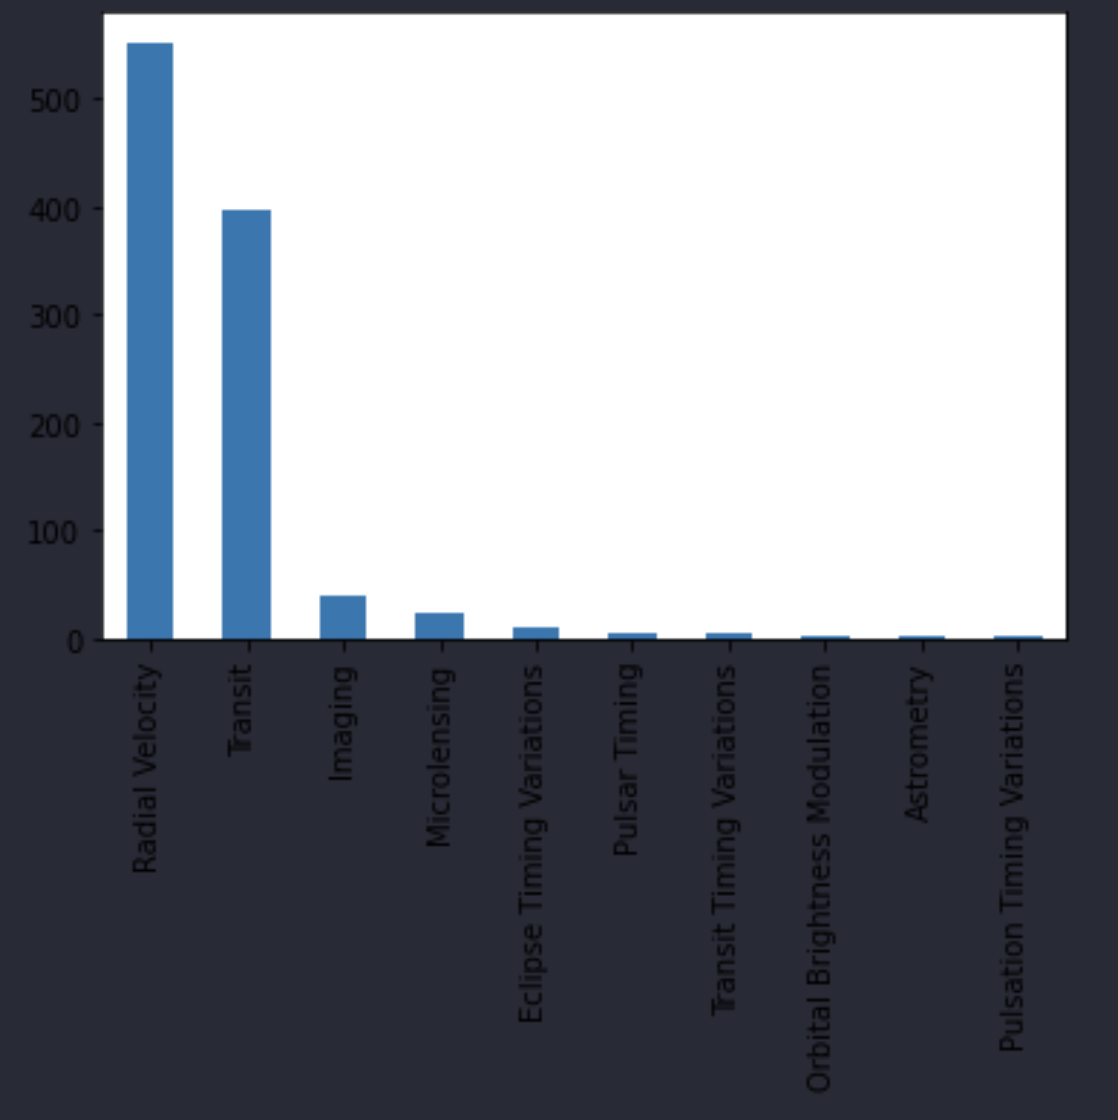
Out of the 3 most common discovery methods, which appears to be the most capable of finding
faraway exoplanets?
df['method'].value_counts().plot.bar()

# here I can see that Radial Velocity, Transit, and
# Imaging are the three most common discovery methods
Now that I know which are the three most common discovery methods, I’ll just create a separate dataframe that I can work with.
most_common_methods_df = df[(df['method'] == 'Radial Velocity') | (df['method'] == 'Transit')
   | (df['method'] == 'Radial Velocity')]
Before I start to find the basis for what constitutes a “faraway planet”, I was thinking about whether or not I should cleanup outliers or missing values for some of these entries. I ran some code to find out that more than half of the dataframe has rows that has at least one column of data missing. So I had a bit of conflict as to how I should approach cleaning this up. Here were options that I thought I had:
1) Get rid of all the rows that have missing values. This would lead to a loss of more than 50% of our data. I thought this was too drastic.
2) Get rid of any column that has a missing value. I also thought this was a bad idea. To my knowledge, there were only three columns in this dataframe that pertained to rudimentary information about these planets. Getting rid of even one column would lose me 1/3 of my columns, also too drastic.
3) I could just leave it.
Here’s a visualization of all the missing values in our dataset.
sns.heatmap(df.isnull(), cbar = False, yticklabels= False)
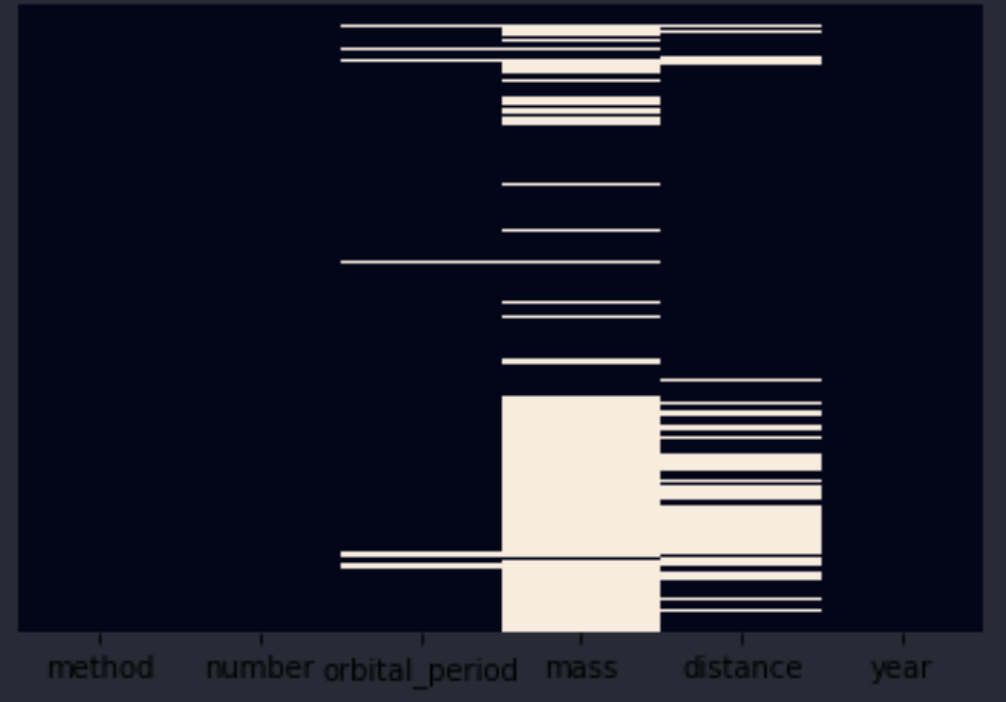
In the end, I decided to leave the dataset, as is.
Now, I just want to find out what’s considered a “faraway planet”.
df['distance'].describe()

# I see that the 75th percentile lies at 178.5 units of distance. So I'll consider that my cutoff
| |
distance |
| count |
808 |
| mean |
264.069 |
| std |
733.116 |
| min |
1.35 |
| 25% |
32.56 |
| 50% |
55.25 |
| 75% |
178.5 |
| max |
8500 |
methods_above_75th_series = most_common_methods_df[df['distance'] > 178.5]['method']
# So here's a series object that contains all the planets beyond 178.5 units of distance

methods_above_75th_series.value_counts().plot.bar()
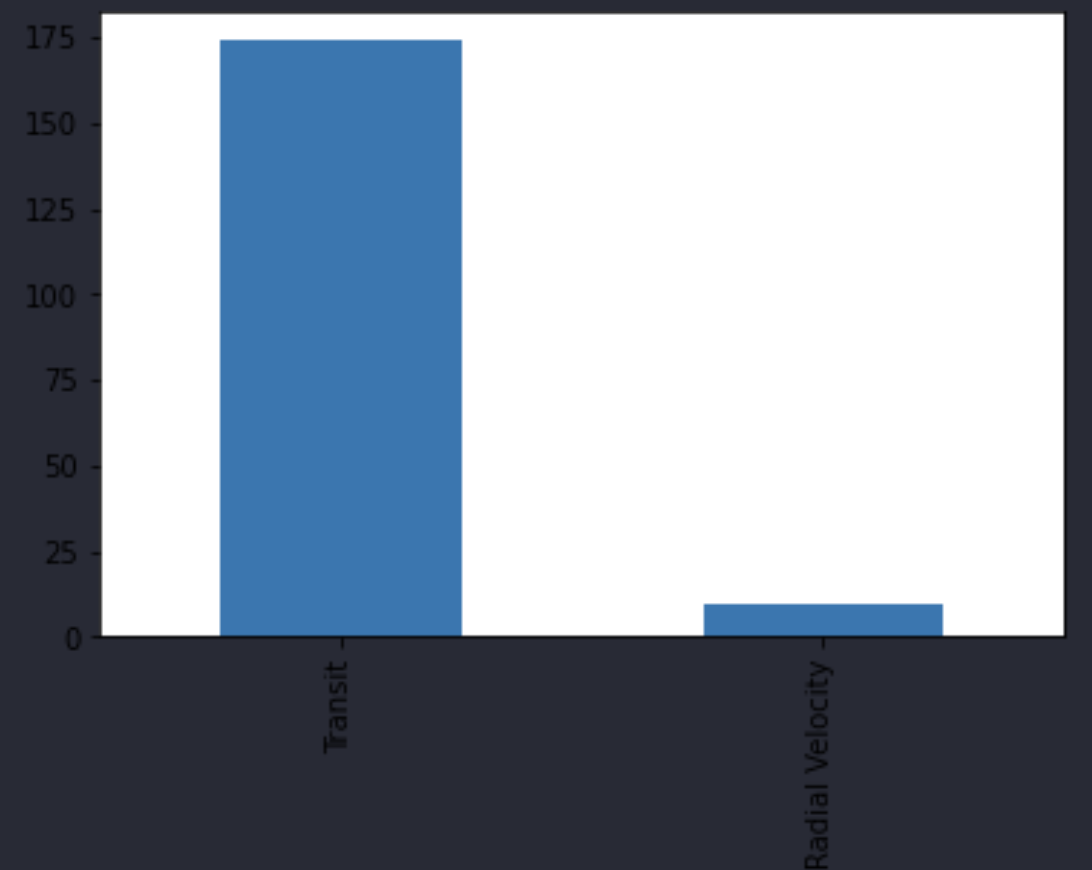
And as you can see, the ‘Transit’ method of discovery is most common with finding exoplanets that are far away
What is the average distance of exoplanets whose mass is known? What is the average distance
of exoplanets whose mass is unknown?
df[df['mass'].notna()]['distance'].mean(), df[df['mass'].isna()]['distance'].mean()

>>> (52.068212851405626, 604.638741935484)
It looks like the average distance for planets that have their mass known is significantly less than the average distance for planets that have unknown mass. It’s safe to infer that the farther a planet is, the harder it is to gauge its mass. Compared to planets that are closer, it’s easier to guage their mass since they’re easier to study.
Which exoplanet discovery method is responsible for the most missing mass values?
df[df['mass'].isna()]['method'].value_counts().plot.bar()
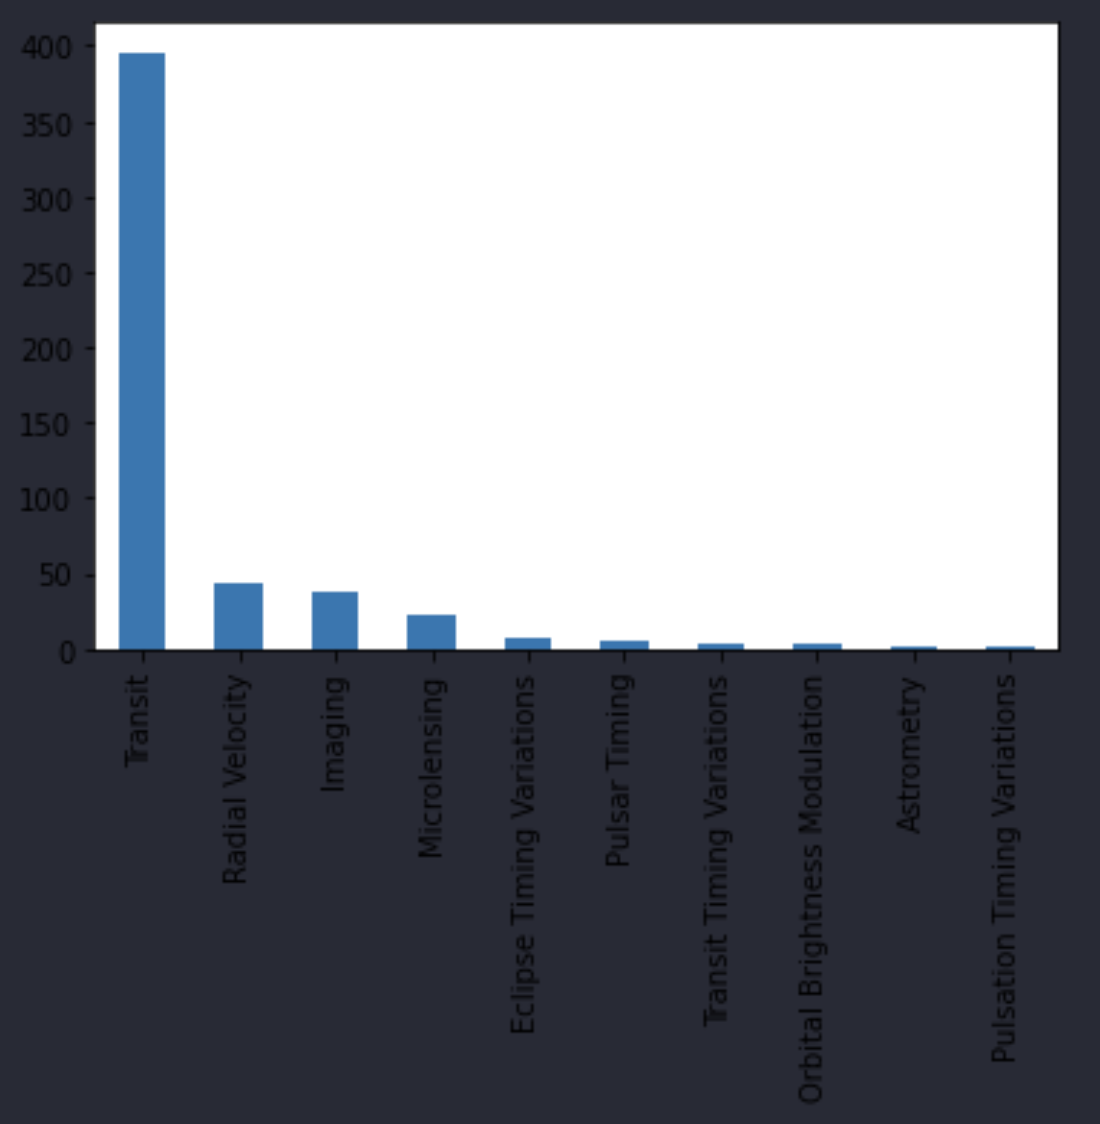
So it looks like the transit method is responsible for the most missing mass values. I do think that this method is unsuitable for determining the mass of exoplanets. This could be because this method is specifically designed to only find planets that are unusually far. There could be a different method entirely dedicated towards finding out the mass of the planets from Transit.
Citing from this NASA article that details how Transit works.
It seems like the practice of using Transit is a method that involves not the direct line of sight with the planet itself, but the shadow generated by the star it is passing in front of. Therefore, I imagine it would be next to impossible to find the mass of a planet using a mere shadow.